


The Drivers Behind REIT Dividend Growth

Last time, we looked at Realty Income (O) as a case study in how using earnings per share (EPS) to calculate payout ratios for real estate investment trusts (REITs) can produce misleading results.
As noted, some public data providers showed payout ratios for Realty Income well above 100%, which might alarm income-focused investors at first glance.
But as noted, the proper metric is adjusted funds from operations (AFFO), a non-GAAP measure that adjusts net income by adding back non-cash items like depreciation and amortization.
This is critical in real estate, where property assets lose book value on paper despite often appreciating in reality. It also excludes gains or losses from property sales, offering a clearer picture of recurring cash flow.
Realty Income is a flagship REIT, well known for its monthly dividend payments and its membership in the S&P 500 Dividend Aristocrats Index, having increased its dividend for more than 25 consecutive years.

Today’s piece builds on that by taking a closer look at the underlying mechanics that allow Realty Income and other high-quality REITs to grow their distributions over decades without compromising sustainability.
Dividends Must Follow Cash Flow
The chart below illustrates exactly what investors should hope to see from a high-quality REIT: consistent growth in AFFO.
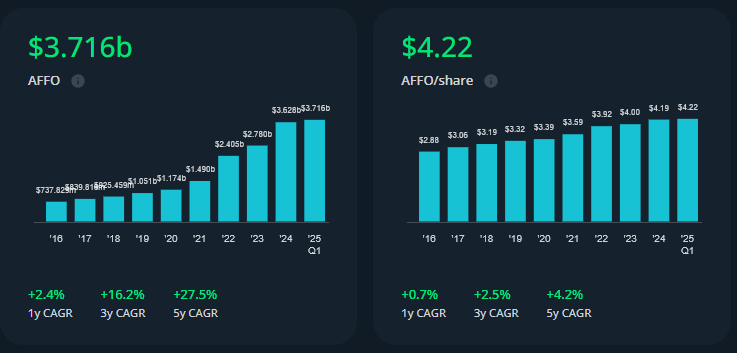
While Realty Income’s dividend shows the familiar stair-step pattern of monthly increases over time, what’s most important is that this growth appears supported by a steadily rising AFFO base.
This relationship is key: dividends don't exist in a vacuum. They're funded by real operating cash flow, and here we can see that AFFO has grown roughly in tandem with distributions, especially since the sharp post-pandemic rebound beginning in 2021.
This alignment is what helps ensure long-term dividend sustainability. Without it, dividend growth would eventually come at the cost of balance sheet health.
Occupancy Rate Is Your Anchor
One of the most reliable indicators of a REIT’s health is its occupancy rate. This metric tells you what percentage of a REIT’s total properties are currently leased and producing rental income.
It’s calculated quarter to quarter as the number of leased properties divided by the total leasable properties in the portfolio.
What’s considered “good” varies depending on the REIT’s focus. For example, post COVID-19 an office REIT may naturally carry a bit more vacancy than one focused on essential retail. But in all cases, stability is key.
Realty Income continues to set the standard. As of March 31, 2025, its occupancy rate stood at 98.5%. That’s down just slightly from 98.7% at the end of 2024 and 98.6% a year prior.

In other words, almost no change, which is especially impressive when managing over 15,000 properties. That level of consistency offers a clear signal that tenant demand remains strong and that management is effectively executing renewals or filling vacancies quickly.

For income-focused investors, this stability is foundational. A high, steady occupancy rate anchors rental revenue, which in turn supports consistent FFO growth.
Over the long run, we believe investors should look for REITs with occupancy rates consistently above 95% and minimal quarter-to-quarter volatility.
Same Store Rental Revenue is Your Organic Growth Driver
While occupancy rate provides a solid foundation, it doesn’t tell the full story. What really drives income growth is how much tenants are paying over time and whether those payments are increasing at a healthy pace. That’s where same store rental revenue comes in.
Same store rental revenue compares the income generated by a consistent set of properties over time, filtering out the noise from acquisitions or dispositions. It reflects the organic growth of the portfolio by assessing whether existing tenants are renewing at higher rents.
Ideally, those increases help outpace inflation over time. If inflation averages 2%, you want to see rental revenue growth comfortably at or above that level to preserve purchasing power.
Realty Income’s latest quarterly results show same store rental revenue rose 1.3% year-over-year across 14,702 properties. While slightly below the inflation benchmark, that still reflects a positive contribution to FFO and ultimately dividends.

In today’s tighter environment for tenants and rent growth, any gain, particularly across such a large base is notable. It suggests leases are being executed or renewed at favorable terms, reinforcing Realty Income’s reputation for operational discipline and tenant quality.
About Us
Jay D. Hatfield is CEO of Infrastructure Capital Advisors and is the lead portfolio manager of the Infrastructure Capital Bond Income ETF (NYSE: BNDS), InfraCap Small Cap Income ETF (NYSE: SCAP), InfraCap Equity Income Fund ETF (NYSE: ICAP), InfraCap MLP ETF (NYSE: AMZA), Virtus InfraCap U.S. Preferred Stock ETF (NYSE: PFFA), InfraCap REIT Preferred ETF (NYSE: PFFR) and private funds. Each month Infrastructure Capital hosts a monthly economic webinar; you can sign up to attend by visiting our website www.infracapfunds.com (important disclosures can also be found on the website). For a prospectus please reach out to us or visit the links above for each respective fund.
DISCLOSURE
This information is not an offer to sell, or solicitation of an offer to buy any investment product, security, or services offered by Jay Hatfield, or Infrastructure Capital Advisors, LLC, (“ICA”) or its affiliates. ICA, will only conduct such solicitation of an offer to buy any investment product or service offered by ICA, if at all, by (1) purported definitive documentation (which will include disclosures relating to investment objective, policies, risk factors, fees, tax implications and relevant qualifications), (2) to qualified participants, if applicable, and (3) only in those jurisdictions where permitted by law. Jay Hatfield or ICA may have a beneficial long or short position in securities discussed either through stock ownership, options, or other derivatives; nonetheless, under no circumstances does any article or interview represent a recommendation to buy or sell these securities. This discussion is intended to provide insight into stocks and the market for entertainment and information purposes only and is not a solicitation of any kind. ICA buys and sells securities on behalf of its fund investors and may do so, before and after any particular article herein is published, with respect to the securities discussed in any article posted. ICA's appraisal of a company (price target) is only one factor that affects its decision whether to buy or sell shares in that company. Other factors might include, but are not limited to, the presence of mandatory limits on individual positions, decisions regarding portfolio exposures, and general market conditions and liquidity needs. As such, there may not always be consistency between the views expressed here and ICA's trading or holdings on behalf of its fund investors. There may be conflicts between the content posted or discussed and the interests of ICA. Please reach out to the ICA for more information. Investors should make their own decisions regarding any investments mentioned, and their prospects based on such investors’ own review of publicly available information and should not rely on the information contained herein. ICA nor any of its affiliates accepts any liability whatsoever for any direct or consequential loss howsoever arising, directly or indirectly, from any use of the information contained herein. We have not sought, nor have we received, permission from any third-party to include their information in this article. Certain information contained in this document constitutes “forward-looking statements,” which can be identified by the use of forward-looking terminology such as “may,” “will,” “should,” “expect,” “anticipate,” “project,” “estimate,” “intend,” “continue” or “believe” or the negatives thereof or other variations thereon or other comparable terminology. Due to various risks and uncertainties, actual events or results may differ materially from those reflected or contemplated in such forward-looking statements.
The information contained herein represents our subjective belief and opinions and should not be construed as investment, tax, legal, or financial advice. Investors should consider the investment objectives, risks, charges, and expenses carefully before investing. Please read the prospectus carefully before investing. For more information about the Fund, Fund strategies or Infrastructure Capital, please reach out to Craig Starr at 212-763-8336 (Craig.Starr@icmllc.com). The Funds are distributed either by Quasar Distributors, LLC or by VP Distributors, LLC, an affiliate of Virtus ETF Advisers, LLC. ICAP, SCAP, and BNDS ETFs are distributed by Quasar Distributors LLC. PFFA, PFFR, and AMZA ETFs are distributed by VP Distributors, LLC an affiliated of Virtus ETF Advisers, LLC.