

Nasdaq Volatility Runs Hot While the VIX Sleeps: The Growing Case for Option Income
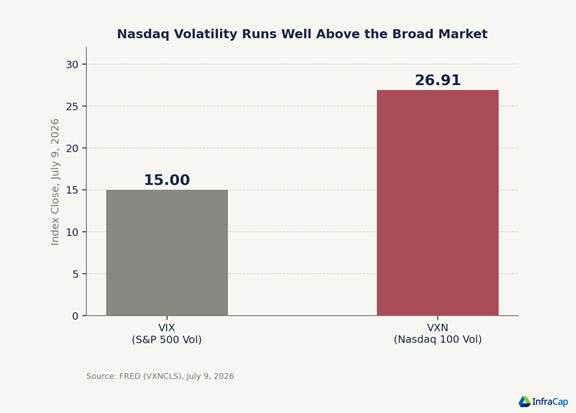
The Nasdaq 100 Volatility Index closed at 26.91 on July 9 while the VIX traded near 15, opening the widest VXN-to-VIX ratio in more than two decades and creating an unusually attractive premium.

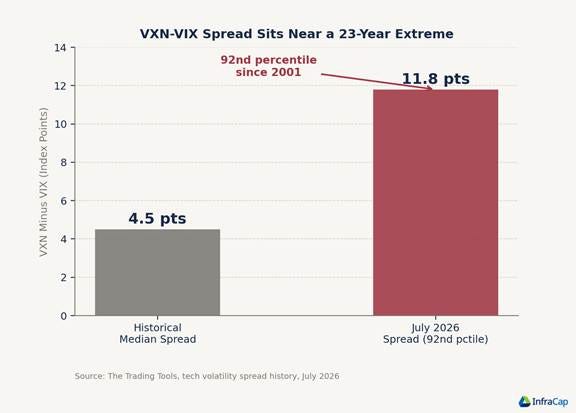
The Nasdaq 100 Volatility Index, known as VXN, closed at 26.91 on July 9, 2026, according to data from the Federal Reserve Bank of St. Louis.(1) Over the same period the CBOE Volatility Index, or VIX, traded near 15, leaving a spread of 11.8 points between the two measures, a gap that sits at the 92nd percentile of readings going back to 2001 according to research from The Trading Tools.(2)
Expressed as a ratio rather than a spread, VXN closed at 1.64 times the level of the VIX, a reading that market commentary described as a 23-year high for that ratio.(3) A gap of this magnitude means options markets are pricing meaningfully more expected turbulence in large-cap technology and growth names than in the broad S&P 500, even though both indexes track large, liquid US equity benchmarks.
Nasdaq Volatility Runs Well Above the Broad Market
Why the Gap Has Opened So Wide
Concentration inside the Nasdaq 100 offers a straightforward explanation for the divergence. A handful of mega-cap technology names carry outsized weight in the index, and heavy positioning in names across the semiconductor, cloud infrastructure, and e-commerce complex has made the benchmark’s options surface unusually sensitive to earnings surprises, capital spending announcements, and shifts in sentiment around artificial intelligence infrastructure spending.
That concentration effect shows up directly in implied volatility pricing. When a small number of stocks account for an outsized share of an index’s market capitalization, single-name volatility in those stocks transmits more directly into index-level volatility than it would in a more broadly diversified benchmark like the S&P 500, where idiosyncratic moves in any one name are diluted across hundreds of constituents.
VXN-VIX Spread Sits Near a 23-Year Extreme
Option Income Strategies Have Room to Work
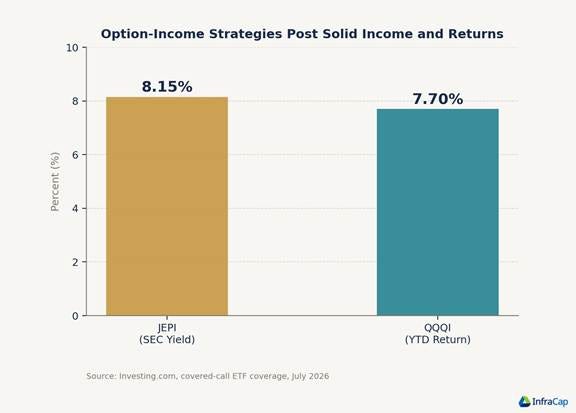
A wider volatility surface on the Nasdaq 100 translates directly into richer option premiums for strategies that sell call options against an underlying equity position, since option prices rise with implied volatility all else equal. Option-income strategies focused on Nasdaq exposure have grown alongside this dynamic. The NEOS Nasdaq 100 High Income ETF, ticker QQQI, returned approximately 7.7 percent year to date as of early July 2026, while the JPMorgan Equity Premium Income ETF, ticker JEPI, carried an 8.15 percent yield over the same period, according to Investing.com coverage of the covered-call ETF category.(4)
Growth in that category reflects investor appetite for capturing elevated option premium as current income rather than solely through price appreciation. A wide VXN-VIX spread of the kind seen in early July 2026 is precisely the environment in which option-selling strategies tend to generate the richest premium relative to the underlying index’s realized volatility, since the market is pricing in more uncertainty than has typically materialized in realized price swings.
Option-Income Strategies Post Solid Income and Returns
What an Elevated Spread Signals for Positioning
A volatility gap at the 92nd percentile of its historical range is not a permanent feature of the market, and mean reversion in the spread between Nasdaq and broad-market volatility has occurred repeatedly over the past two decades. Investors evaluating option-income approaches focused on Nasdaq exposure should recognize that the premium available today reflects a specific, unusually wide dislocation rather than a baseline level that will necessarily persist.
The concentration dynamics that produced this spread, heavy index weighting in a small number of technology and growth names, are structural features of the Nasdaq 100 that are unlikely to disappear even if the volatility gap itself narrows. That combination of a structurally concentrated benchmark and a currently elevated volatility premium is why option-income strategies tied to Nasdaq exposure have drawn growing attention as a way to monetize a volatility surface that has rarely been this rich relative to the broader market.
1. Federal Reserve Bank of St. Louis, FRED series VXNCLS, data through July 9, 2026.
2. The Trading Tools, tech volatility spread research, July 2026.
3. KuCoin news coverage, Nasdaq 100 Volatility Index versus VIX ratio analysis, July 2026.
4. Investing.com, covered-call ETF category coverage, July 2026.
About Us
Infrastructure Capital Advisors LLC is a SEC-registered investment adviser based in New York. The firm offers an ETF suite covering bond income, small-cap income, equity income, MLPs, preferred stock, and REIT preferreds. Funds: BNDS (Infrastructure Capital Bond Income ETF); SCAP (InfraCap Small Cap Income ETF); ICAP (InfraCap Equity Income Fund ETF); AMZA (InfraCap MLP ETF); PFFA (Virtus InfraCap U.S. Preferred Stock ETF); PFFR (InfraCap REIT Preferred ETF). For more information visit www.infracapfunds.com.
DISCLOSURE
This information is not an offer to sell, or solicitation of an offer to buy any investment product, security, or services offered by Jay Hatfield, or Infrastructure Capital Advisors, LLC, (”ICA”) or its affiliates. ICA, will only conduct such solicitation of an offer to buy any investment product or service offered by ICA, if at all, by (1) purported definitive documentation (which will include disclosures relating to investment objective, policies, risk factors, fees, tax implications and relevant qualifications), (2) to qualified participants, if applicable, and (3) only in those jurisdictions where permitted by law. Jay Hatfield or ICA may have a beneficial long or short position in securities discussed either through stock ownership, options, or other derivatives; nonetheless, under no circumstances does any article or interview represent a recommendation to buy or sell these securities. This discussion is intended to provide insight into stocks and the market for entertainment and information purposes only and is not a solicitation of any kind. ICA buys and sells securities on behalf of its fund investors and may do so, before and after any particular article herein is published, with respect to the securities discussed in any article posted. ICA’s appraisal of a company (price target) is only one factor that affects its decision whether to buy or sell shares in that company. Other factors might include, but are not limited to, the presence of mandatory limits on individual positions, decisions regarding portfolio exposures, and general market conditions and liquidity needs. As such, there may not always be consistency between the views expressed here and ICA’s trading or holdings on behalf of its fund investors. There may be conflicts between the content posted or discussed and the interests of ICA. Please reach out to the ICA for more information. Investors should make their own decisions regarding any investments mentioned, and their prospects based on such investors’ own review of publicly available information and should not rely on the information contained herein. ICA nor any of its affiliates accepts any liability whatsoever for any direct or consequential loss howsoever arising, directly or indirectly, from any use of the information contained herein. We have not sought, nor have we received, permission from any third-party to include their information in this article. Certain information contained in this document constitutes “forward-looking statements,” which can be identified by the use of forward-looking terminology such as “may,” “will,” “should,” “expect,” “anticipate,” “project,” “estimate,” “intend,” “continue” or “believe” or the negatives thereof or other variations thereon or other comparable terminology. Due to various risks and uncertainties, actual events or results may differ materially from those reflected or contemplated in such forward-looking statements.
This material must be preceded or accompanied by a prospectus. The information contained herein represents our subjective belief and opinions and should not be construed as investment, tax, legal, or financial advice. For a prospectus with this and other information about the Funds, please visit www.infracapfunds.com. Investors should consider the investment objectives, risks, charges, and expenses carefully before investing. Please read the prospectus carefully before investing. For more information about the Funds, Fund strategies or Infrastructure Capital, please reach out to Craig Starr at 212-763-8336 (Craig.Starr@icmllc.com). The Funds are distributed either by Quasar Distributors, LLC or by VP Distributors, LLC, an affiliate of Virtus ETF Advisers, LLC. ICAP, SCAP, and BNDS ETFs are distributed by Quasar Distributors LLC. PFFA, PFFR, and AMZA ETFs are distributed by VP Distributors, LLC an affiliated of Virtus ETF Advisers, LLC.