


How Much Does Income Matter for Total Return? It Depends on the Asset

When comparing asset class performance, one common point of confusion for new investors comes from the benchmark used. There are typically two versions of an index: the price return and the total return.
The price return measures only the change in the index’s market value. The total return version, by contrast, includes both price changes and any income distributions, such as dividends or interest, assuming they’re reinvested.
In virtually every case, the total return will outperform the price return over time, because it reflects the compounding benefit of reinvested income. But how large that difference is can vary significantly.
For some assets, income plays a modest role. For others, it’s the main driver of total return. This makes it a useful lens for understanding how the reinvestment of that income matters. It becomes especially important in real-world applications where tax drag becomes a variable.
Here’s a comparison across three major income-generating asset classes: U.S. large-cap equities, master limited partnerships (MLPs), and real estate investment trusts (REITs).
U.S. Large-Cap Stocks
Over the past decade, the S&P 500 has delivered impressive gains, but much of that return has come from price appreciation.
From early 2015 through mid-2025, the index’s cumulative price return was 183.1%, while its total return was 238.4%. That means reinvested dividends accounted for roughly 23% of the total return.
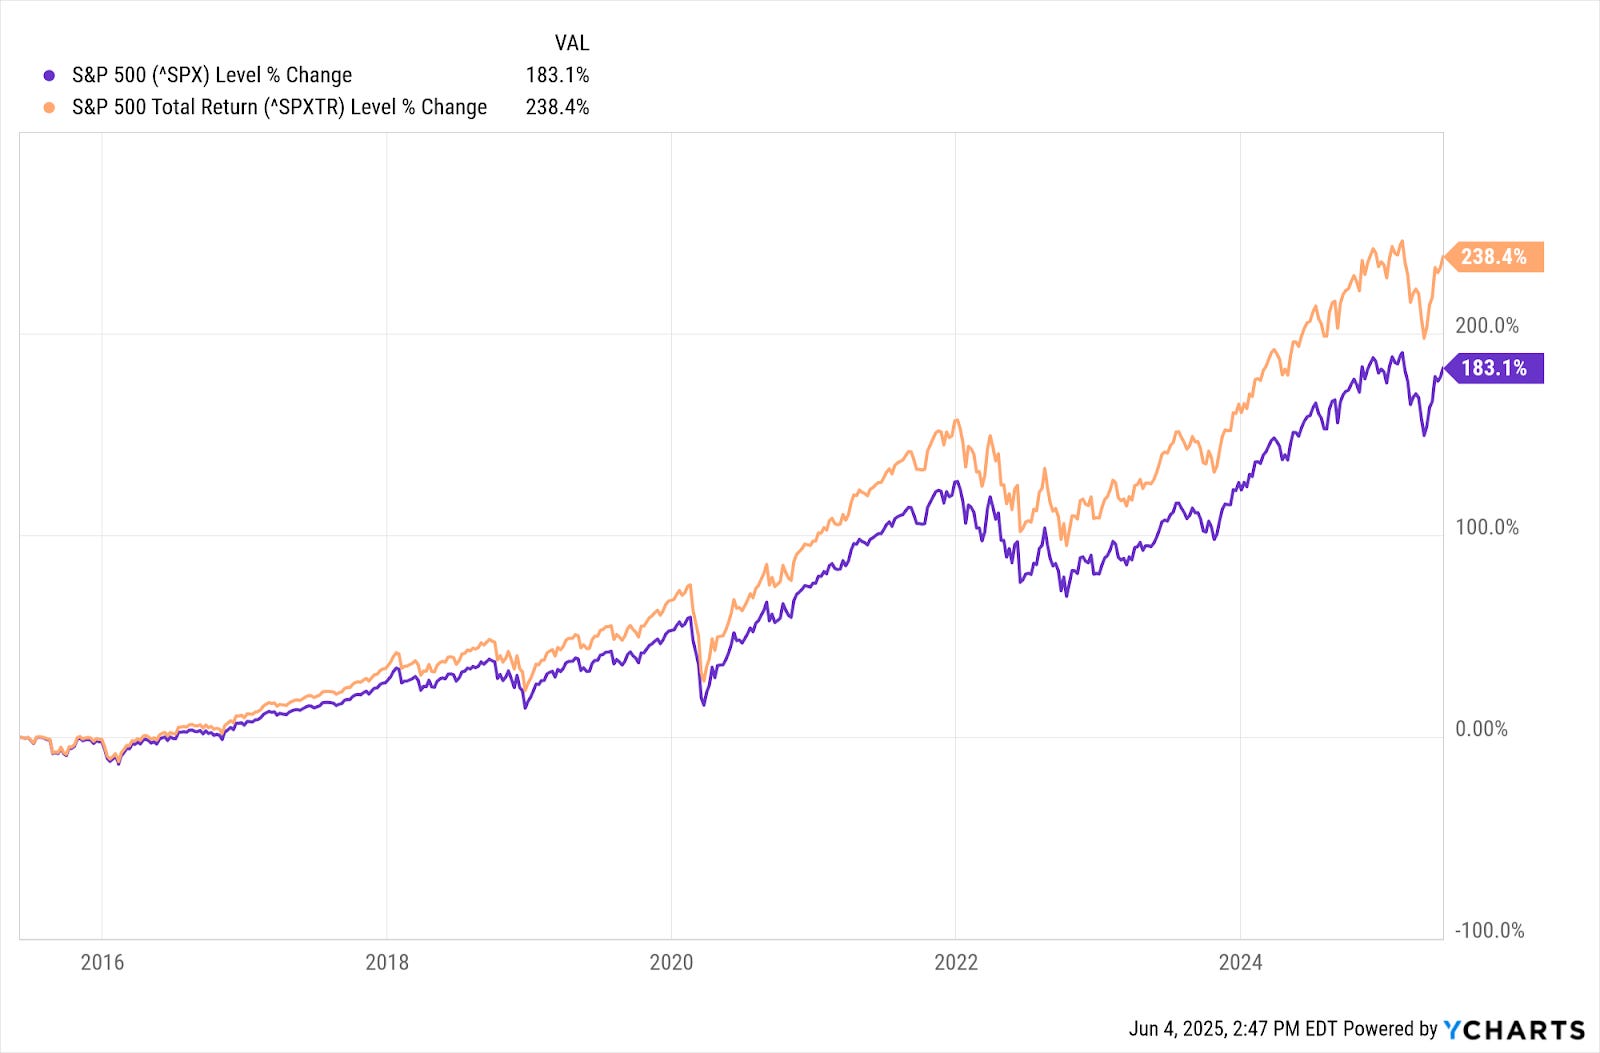
This reinforces the idea that while income matters, its role in U.S. large-cap equities has historically been secondary to price growth.
That’s partly by design: many S&P 500 companies now prioritize capital reinvestment, share buybacks, and acquisitions over high dividend payouts.
Management teams have also become increasingly shareholder-friendly through stock repurchase programs, which boost earnings per share and support higher valuations.
U.S. Real Estate Investment Trusts (REITs)
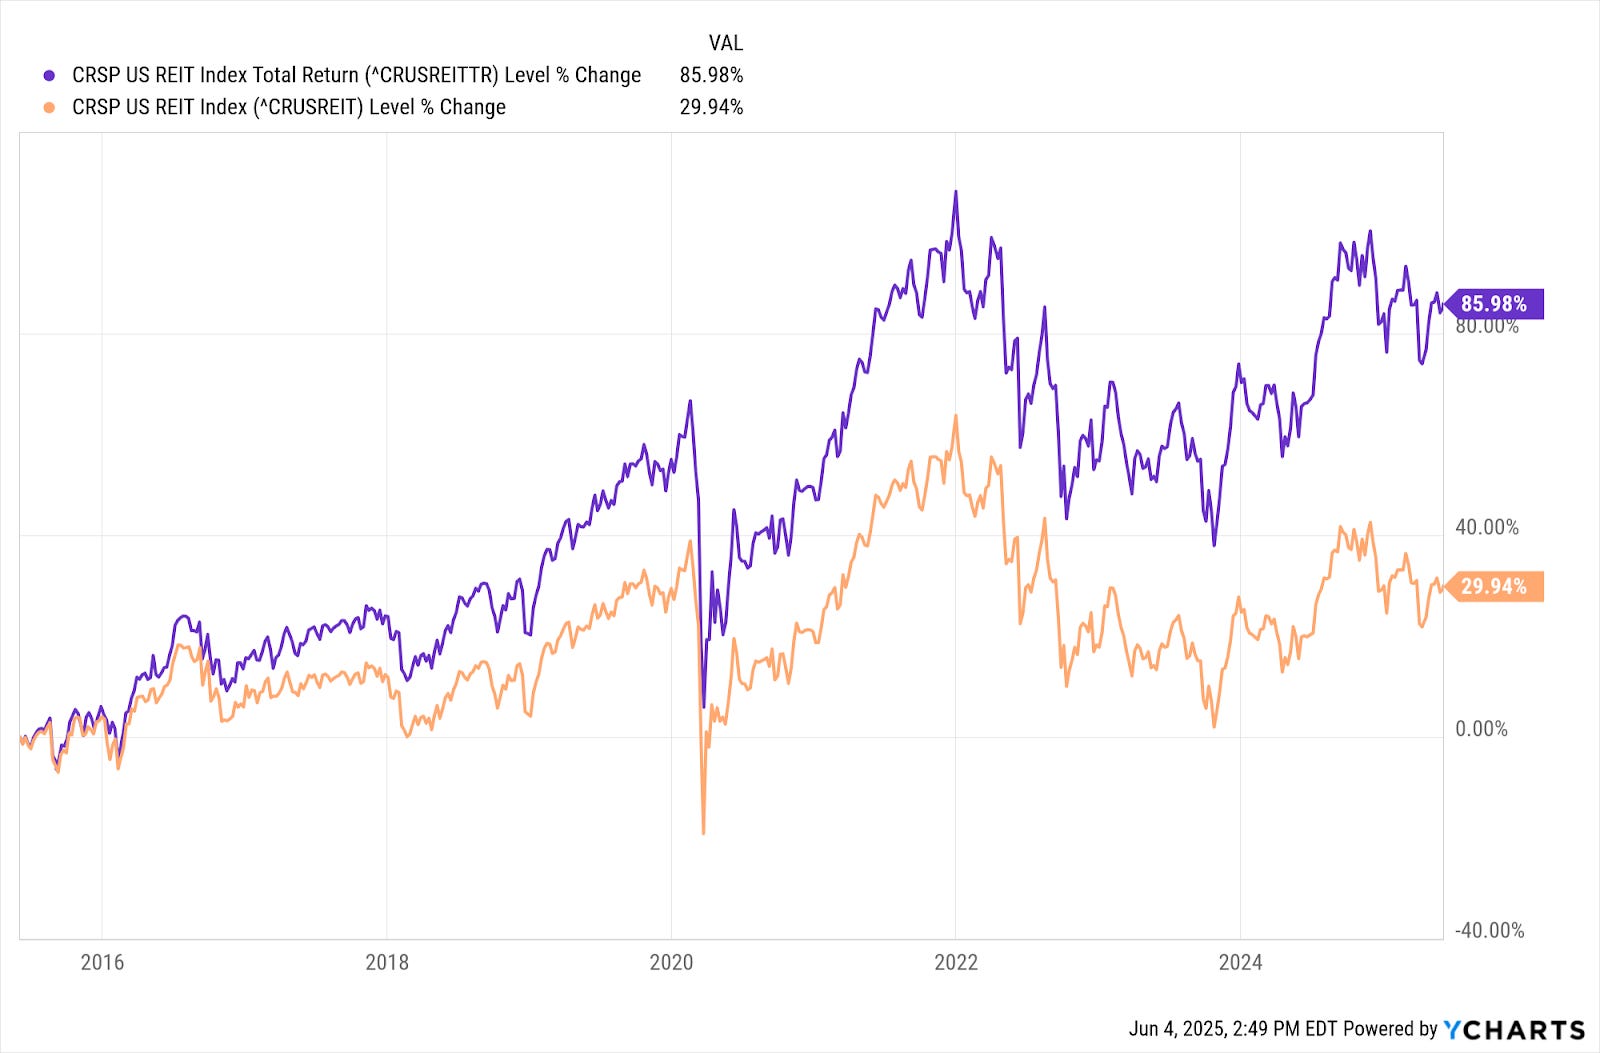
The CRSP US REIT Index paints a striking picture of how meaningful income can be for total returns. From 2015 to 2025, the index’s price return was just 29.94%, while the total return was 85.98%. Roughly two-thirds of the total return came from reinvested distributions.
This outsized income effect is no coincidence. Real estate investment trusts (REITs) are legally required to distribute at least 90% of their taxable income to shareholders in the form of dividends.
This rule allows them to avoid corporate income tax, but it also means REITs tend to offer much higher yields than traditional equities.
Unlike the S&P 500, where capital appreciation tends to carry the load, REITs rely on a stream of predictable, recurring cash flows generated by long-term leases.
While their price can swing due to interest rates or sector sentiment, the dividend engine under the hood keeps turning, and for investors who stay invested, that income becomes a compounding asset all its own.
Master Limited Partnerships (MLPs)
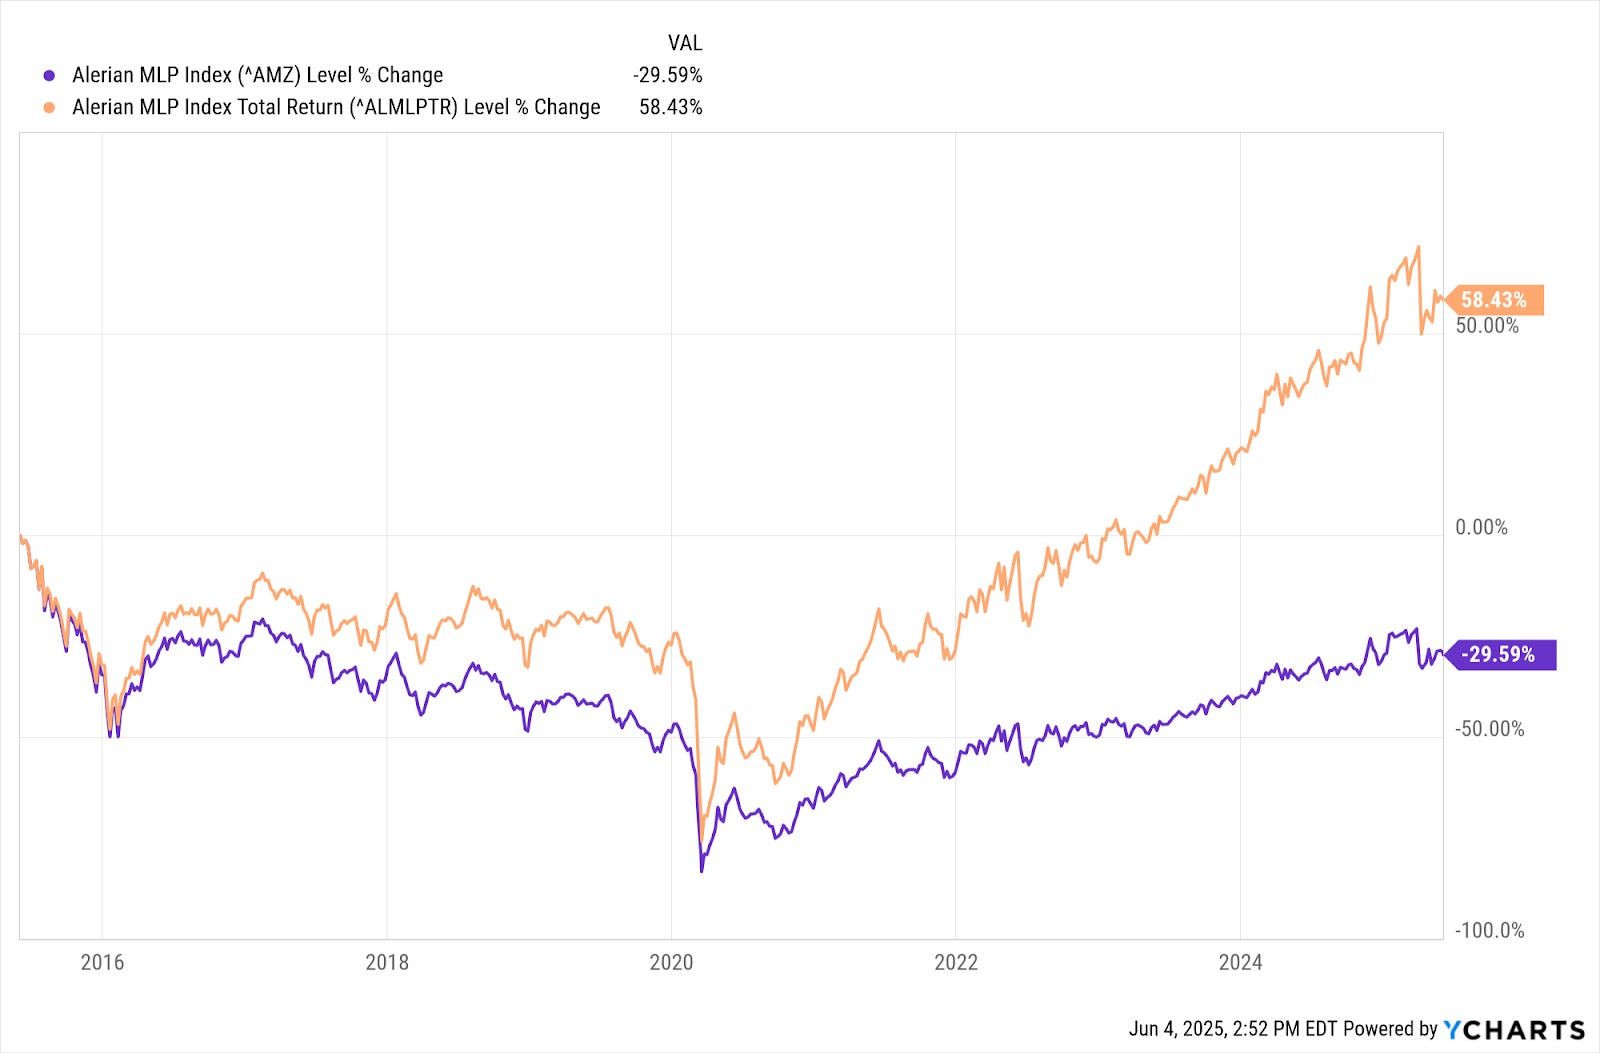
The following chart may be the most dramatic illustration of all. From 2015 to 2025, the Alerian MLP Index price return was -- 29.6%, while the total return version of the same index delivered a positive +58.4%. It all comes down to income.
MLPs are among the highest-yielding assets in public markets, regularly offering yields north of 6% to 8%. Unlike equities, which may retain earnings for buybacks or reinvestment, MLPs are explicitly designed to pass through the bulk of their distributable cash flow.
That’s why price alone paints a misleading picture. In this case, price returns were weighed down by years of energy market volatility, regulatory risks, and investor exits following the 2014 oil crash. But for long-term holders reinvesting distributions, total returns remained solidly positive.
The underlying cash flow from fee-based pipeline infrastructure persisted and investors who understood the income component were rewarded, even when headline prices lagged.
It’s a striking reminder: income-heavy asset classes can defy price action. Ignore distributions, and you miss the entire point of owning MLPs.
About Us
Jay D. Hatfield is CEO of Infrastructure Capital Advisors and is the lead portfolio manager of the Infrastructure Capital Bond Income ETF (NYSE: BNDS), InfraCap Small Cap Income ETF (NYSE: SCAP), InfraCap Equity Income Fund ETF (NYSE: ICAP), InfraCap MLP ETF (NYSE: AMZA), Virtus InfraCap U.S. Preferred Stock ETF (NYSE: PFFA), InfraCap REIT Preferred ETF (NYSE: PFFR) and private funds. Each month Infrastructure Capital hosts a monthly economic webinar; you can sign up to attend by visiting our website www.infracapfunds.com (important disclosures can also be found on the website). For a prospectus please reach out to us or visit the links above for each respective fund.
DISCLOSURE
This information is not an offer to sell, or solicitation of an offer to buy any investment product, security, or services offered by Jay Hatfield, or Infrastructure Capital Advisors, LLC, (“ICA”) or its affiliates. ICA, will only conduct such solicitation of an offer to buy any investment product or service offered by ICA, if at all, by (1) purported definitive documentation (which will include disclosures relating to investment objective, policies, risk factors, fees, tax implications and relevant qualifications), (2) to qualified participants, if applicable, and (3) only in those jurisdictions where permitted by law. Jay Hatfield or ICA may have a beneficial long or short position in securities discussed either through stock ownership, options, or other derivatives; nonetheless, under no circumstances does any article or interview represent a recommendation to buy or sell these securities. This discussion is intended to provide insight into stocks and the market for entertainment and information purposes only and is not a solicitation of any kind. ICA buys and sells securities on behalf of its fund investors and may do so, before and after any particular article herein is published, with respect to the securities discussed in any article posted. ICA's appraisal of a company (price target) is only one factor that affects its decision whether to buy or sell shares in that company. Other factors might include, but are not limited to, the presence of mandatory limits on individual positions, decisions regarding portfolio exposures, and general market conditions and liquidity needs. As such, there may not always be consistency between the views expressed here and ICA's trading or holdings on behalf of its fund investors. There may be conflicts between the content posted or discussed and the interests of ICA. Please reach out to the ICA for more information. Investors should make their own decisions regarding any investments mentioned, and their prospects based on such investors’ own review of publicly available information and should not rely on the information contained herein. ICA nor any of its affiliates accepts any liability whatsoever for any direct or consequential loss howsoever arising, directly or indirectly, from any use of the information contained herein. We have not sought, nor have we received, permission from any third-party to include their information in this article. Certain information contained in this document constitutes “forward-looking statements,” which can be identified by the use of forward-looking terminology such as “may,” “will,” “should,” “expect,” “anticipate,” “project,” “estimate,” “intend,” “continue” or “believe” or the negatives thereof or other variations thereon or other comparable terminology. Due to various risks and uncertainties, actual events or results may differ materially from those reflected or contemplated in such forward-looking statements.
The information contained herein represents our subjective belief and opinions and should not be construed as investment, tax, legal, or financial advice. Investors should consider the investment objectives, risks, charges, and expenses carefully before investing. Please read the prospectus carefully before investing. For more information about the Fund, Fund strategies or Infrastructure Capital, please reach out to Craig Starr at 212-763-8336 (Craig.Starr@icmllc.com). The Funds are distributed either by Quasar Distributors, LLC or by VP Distributors, LLC, an affiliate of Virtus ETF Advisers, LLC. ICAP, SCAP, and BNDS ETFs are distributed by Quasar Distributors LLC. PFFA, PFFR, and AMZA ETFs are distributed by VP Distributors, LLC an affiliated of Virtus ETF Advisers, LLC.